



COVID-19 Coronavirus – Viral Pandemic Prediction Tools + Live Maps, Stats & Widgets

 Recently Updated
Well Documented
Recently Updated
Well Documented

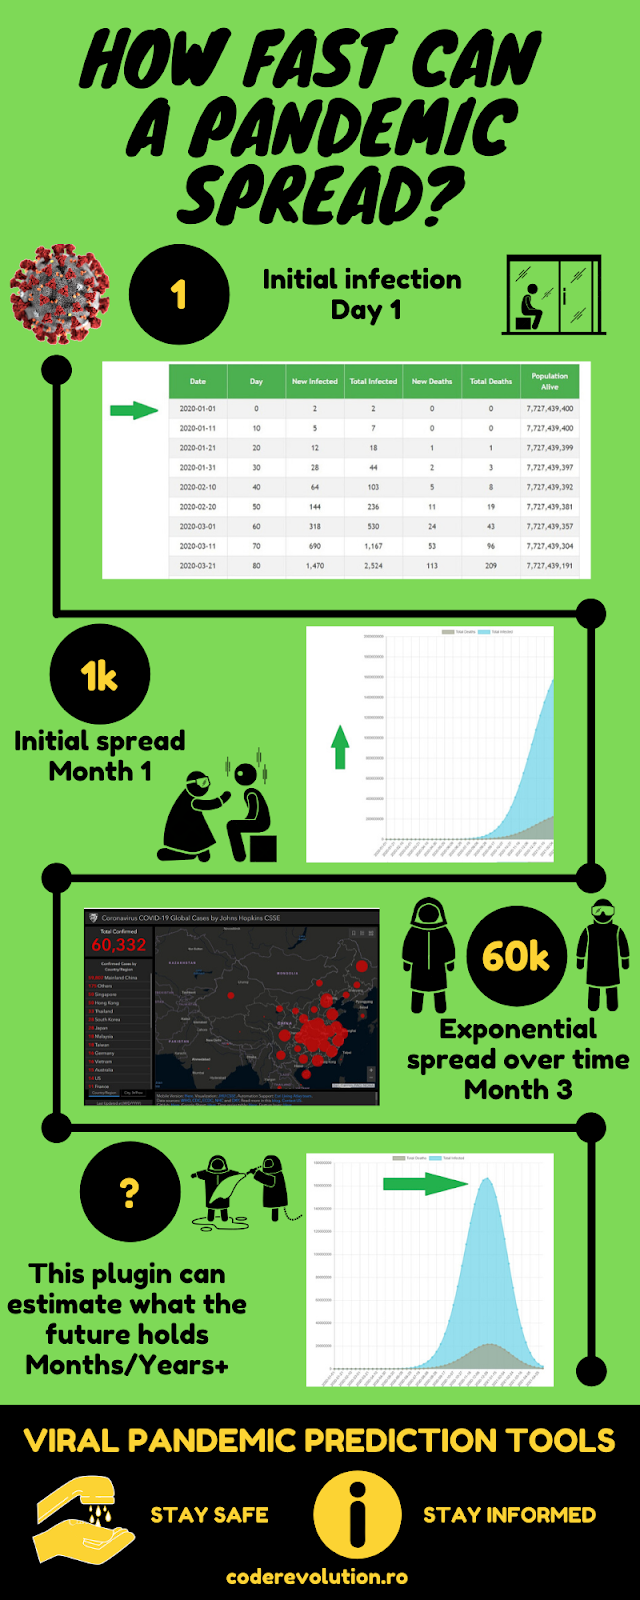



What Can You Do With This Plugin?
COVID-19 Coronavirus – Viral Pandemic Prediction Tools Plugin for WordPress is a breaking edge pandemic modeling software, that will allow you to visualize using charts and tables with estimated data, the possible impact of pandemics, on society. You will be able to model the possible magnitude and severity of a pandemic (local or worldwide).
How fast can the COVID-19 Coronavirus spread?
Learn how the SARS-CoV-2 Coronavirus causing the COVID-19 disease (Wuhan China Outbreak or Pandemic) can spread rapidly with this Coronavirus Spreading Prediction Tool. Test your own scenarios or use real live data from CDC / WHO to update your own personal website that will contain a personalized Coronavirus Prediction Tool! COVID-19 Coronavirus – Viral Pandemic Prediction Tools WordPress Plugin is a powerful tool to inform your website’s visitors about the impact of a global pandemic, which might be caused by the COVID-19 Coronavirus. – You can embed tables and charts with the prediction of the evolution of the spreading of a global or regional pandemic. – It can also use iframes to automatically embed dashboards from WHO and Johns Hopkins, to track in real time the progress of the outbreak. – It can use historical data from JHU and make predictions for the future of the pandemic, based on the real life data imported from JHU dashboard. The goal is to achieve the following: COVID-19 Coronavirus – Viral Pandemic Prediction Tools will automatically create prediction tables and charts
Predict possible outcomes for the a possible pandemic
Predict the spread of the COVID-19 Coronavirus outbreak (formerly Wuhan China Virus 2019-nCoV) with this plugin. It was built to allow you to enter our own parameters and automatically estimate and predict the speed and magnitude of the Novel Coronavirus spreading
Think also about the economic impact
Predict and chart the disruption of the global workforce, in case of a global pandemic. A percentage of the population who is in the active workforce will need to stay at home and will not be able to go to work. This might bring a severe global economic impact. This feature was added in the v1.1.1 update for the plugin.
Allow your visitors to experiment with data and results
Allow your website’s users to create their own scenarios and watch charts and prediction tables about how the pandemic will unfold, based on the parameters they entered
Many parameters to change
You can change a multitude of parameters that will influence the speed and magnitude of the spreading of the disease. Parameters include: starting population, start date, initial infected count, unkillable elite in bunkers, infection rate, incubation period, mortality rate, mortality complicator, disease burnout rate
Embed Official Dashboards to track the outbreak in real time
The plugin also allows the direct embedding of official dashboards that follow and report the current situation on the Coronavirus outbreak, directly to your web site. Supported dashboards:
- Johns Hopkins CSSE dashboard
- WHO dashboard
- v1.1.3 update: huge number of other embeds added (all from below):
- Italy COVID-19 live map
- Romania COVID-19 live map
- HealthMap
- NextStrain Visus Strain Graph
- Hong Kong COVID-19 live map
- Macau COVID-19 live map
- Shenzhen China COVID-19 live map
- China Live Map
- JHU Dashboard
- University of Virginia Dashboard
- Germany COVID-19 live map
- Japan COVID-19 live map
- South Korea COVID-19 live map
- Singapore COVID-19 live map
- Portugal COVID-19 live map
- Taiwan COVID-19 live map
- Indonesia COVID-19 live map
- Philippines COVID-19 live map
- Thailand COVID-19 live map
- University of Oklahoma Dashboard
- Evolution Map
- 3D Globe Interactive Dispersion Map
- Israel COVID-19 live map
- Turkey COVID-19 live map
- Cases Map
- Spread Map
- Global Confirmed Deaths and Recovered Chart
- Global Deaths and Recovered Chart
- Worst Affected Areas Chart
- Affected Countries Map
- Bing Dashboard
- LiveData Dashboard
- Florida COVID-19 live map
- Switzerland COVID-19 live map
- Europe COVID-19 live map
- UK COVID-19 live map
- London COVID-19 live map
- Sweden COVID-19 live map
- Global Map
- Country Graphs Table
- Country List Table
- Denmark COVID-19 live map
- India COVID-19 live map
- Global Spread Map Animated
- Confirmed and Recovered Map
- Country Chart Alternative Version
- World Map Alternative Version
- USA COVID-19 live map
- USA COVID-19 live map alternative
- USA Travel Ban live map
- And many more to come in future updates…
Interactive charts for details
The plugin will generate beautiful and interactive charts and tables that will present the evolution of the disease, based on the parameters you enter in it’s settings
Gutenberg blocks and shortcodes
The plugin provides Gutenberg blocks, shortcodes and TinyMCE buttons for easy embedding of the content it generates. All you have to do is push a button, configure some parameters and you will get the results on your site automatically
Design your charts
The plugin will allow you to design the appearance of the charts and tables you add to your page. Simply change some parameters from the Gutenberg blocks or shortcodes and the charts will be customized to fit the design of your site
Sample data for use
The plugin will provide some sample data you can use to test the features provided by the charts and tables. Sample historical data is provided for: the Common Flu, SARS, MERS, Spanish Flu and estimated data for the current SARS-CoV-2, which causes COVID-19.
Parameter Explanations
- Starting Population – The starting population for the outbreak/pandemic. This can be the population of the globe, your country, city or even university.
- Elite in Bunkers and Immune – This is the number of people that will never get sick – because they are naturally immune or they are hiding in bunkers or are fully isolated from the infected population.
- Start Date – This is the date when the first patient is infected.
- Initial Infections – The number of initial infections that occurred on the start date.
- Infection Rate (R0) – The number of additional people that are infected by a single patient that already has the virus (during the incubation period).
- Incubation Period (Days) – The average time from becoming infected to showing thee first symptoms.
- Mortality Rate (Percentage) – How many people die of the virus as a percentage of those who become infected (an average death rate).
- Mortality Complicator (Percentage) – This will increase the ‘Mortality Rate’ where there is a large number of new infected in a short period of time and is based on the increasing likelihood of mortality as more of the health care system becomes overwhelmed (more and more severe and critical cases that need medical help to survive, in a short period of time).
- Virus Burnout Rate (Percentage) – This represents a reduction of the ‘Infection Rate’ over time – it represents the increased quarantine measures, progress with discovering a cure or vaccine and fewer healthy hosts to infect.
Updates
- v1.1.0:
- v1.1.1:
- v1.1.2:
- v1.1.3 HUGE UPDATE:
- v1.1.4:
- v1.1.5:
- added Pandemic Symptoms Chart
- v1.1.6:
- download charts, reports and reports as PDF files
- added a dashboard to follow the COVID-19 outbreak from Canada
- v1.1.7:
- added the ability for your website’s visitors to query COVID-19 confirmed/cured/deaths for a country they enter
- added many graphs, charts and tables (updated live, automatically) to follow the evolution of the COVID-19 pandemic
- v1.1.8:
- added pandemic simulation charts, based on historical data – example for Italy
- added pandemic simulation tables, based on historical data – example for Italy
- tutorial video for this new feature: here
- v1.2.0:
- performance improvements
- v1.3.0:
- fixed prediction data, working again after API changes

Testing this plugin
- You can test the plugin’s functionality using the ‘‘Plugin’s Front End Demo’’. Here you can try the plugin’s features on a fully configured demo site – you can check graphs and results.
- You can test the plugin’s functionality using the ‘‘Plugin’s Back End Demo’’. Here you can try the plugin’s full functionality. Note that the generated testing blog will be deleted automatically after 24 hours.


Need support?
Please check our knowledge base, it may have the answer to your question or a solution for your issue. If not, just email me at [email protected] and I will respond as soon as I can.


Changelog:
Version 1.0.0 Release Date 2020-02-13
First version released!
Version 1.1.0 Release Date 2020-02-16
New table added - summary of pandemic modelling results
New chart added - summary of pandemic modelling results - compare cured, dead and uninfected population
Added description of configurable parameters
Bugfixes
Version 1.1.1 Release Date 2020-03-08
New chart added - workforce disruption graph
Version 1.1.2 Release Date 2020-03-11
New chart added - disease severity graph
New chart added - deaths by age group graph
Version 1.1.3 Release Date 2020-03-17
Added a huge list of embeds, charts, maps, graphs and live data to embed to your site.
Version 1.1.4 Release Date 2020-03-18
Added a new chart to simulate the number of newly required hospitalizations during the pandemic.
Version 1.1.5 Release Date 2020-03-20
Added a new chart to simulate the number of people developing different symptoms specific for the COVID-19 disease
Version 1.1.6 Release Date 2020-03-20
Added a new feature to allow website visitors to download the charts and table that the plugin generates, as PDF files
Added a dashboard to follow the COVID-19 outbreak from Canada
Version 1.1.7 Release Date 2020-03-25
Added a new feature to allow website visitors to query COVID-19 confirmed/cured/deaths count for different countries
Added many new graphs and charts to follow the evolution of the pandemic
Version 1.1.8 Release Date 2020-03-28
Added a new feature to allow table simulation of COVID-19 pandemic, based on historical data from JHU
Added a new feature to allow chart simulation of COVID-19 pandemic, based on historical data from JHU
Version 1.2.0 Release Date 2020-05-19
Performance improvements
Version 1.2.1 Release Date 2020-06-30
Fixed some small reported bugs
Version 1.3.0 Release Date 2020-08-02
Prediction graphs working again after changes in API
Version 1.3.1 Release Date 2021-01-16
PHP 8 compatibility update
Version 1.3.1.1 Release Date 2023-10-18
Fixed PHP 8.2 related errors
Are you already a customer?
If you already bought this and you have tried it out, please contact me in the item’s comment section and give me feedback, so I can make it a better WordPress plugin! WordPress 7.0 and PHP 8.5 Tested!




Changelog:
Version 1.0.0 Release Date 2020-02-13
First version released!
Version 1.1.0 Release Date 2020-02-16
New table added - summary of pandemic modelling results
New chart added - summary of pandemic modelling results - compare cured, dead and uninfected population
Added description of configurable parameters
Bugfixes
Version 1.1.1 Release Date 2020-03-08
New chart added - workforce disruption graph
Version 1.1.2 Release Date 2020-03-11
New chart added - disease severity graph
New chart added - deaths by age group graph
Version 1.1.3 Release Date 2020-03-17
Added a huge list of embeds, charts, maps, graphs and live data to embed to your site.
Version 1.1.4 Release Date 2020-03-18
Added a new chart to simulate the number of newly required hospitalizations during the pandemic.
Version 1.1.5 Release Date 2020-03-20
Added a new chart to simulate the number of people developing different symptoms specific for the COVID-19 disease
Version 1.1.6 Release Date 2020-03-20
Added a new feature to allow website visitors to download the charts and table that the plugin generates, as PDF files
Added a dashboard to follow the COVID-19 outbreak from Canada
Version 1.1.7 Release Date 2020-03-25
Added a new feature to allow website visitors to query COVID-19 confirmed/cured/deaths count for different countries
Added many new graphs and charts to follow the evolution of the pandemic
Version 1.1.8 Release Date 2020-03-28
Added a new feature to allow table simulation of COVID-19 pandemic, based on historical data from JHU
Added a new feature to allow chart simulation of COVID-19 pandemic, based on historical data from JHU
Version 1.2.0 Release Date 2020-05-19
Performance improvements
Version 1.2.1 Release Date 2020-06-30
Fixed some small reported bugs
Version 1.3.0 Release Date 2020-08-02
Prediction graphs working again after changes in API
Version 1.3.1 Release Date 2021-01-16
PHP 8 compatibility update
Version 1.3.1.1 Release Date 2023-10-18
Fixed PHP 8.2 related errors
Only logged in customers who have purchased this product may leave a review.
Loading...
WPBay support
 Support by CodeRevolution
Support by CodeRevolution
CodeRevolution supports this product through WPBay
Questions are handled in WPBay's private ticket system, keeping your purchase details and support conversation together.
Go to My Downloads
After purchase, open this item in My Downloads and choose Get Support.
What support includes
- Answers to product-related questions
- Help with reported bugs and issues
- Guidance for included third-party assets
What support does not include
- Customizations or new features
- Installation or setup services
Plugin
Maintenance snapshot
See recent updates, compatibility, support, and developer activity.
- Updated 29 days ago
- Developer active recently
- WPBay support available
- WordPress 7.1 tested
Snapshot updated 4 hours ago
View details Hide details
Maintenance details
This is maintenance data. It does not measure product quality or sales.
- Last update Updated 29 days ago
- Compatibility WordPress 7.1 tested · PHP 8.5 tested · WooCommerce 11 tested
- Releases 1 release in the 238 days since listing
- Developer activity Developer active recently
- Support No recent support tickets to measure
- Docs and demo Documentation available · Changelog available · Demo available
Health reflects increased activity during the last 90 days.
How this snapshot works
Plugin Health
The score is out of 100 and uses data WPBay can check. Ratings, popularity, and sales are not used.
- Last update 30 points
-
Plugins receive full recency points under 30 days, then step down at 90, 180, 365, and 545 days.
- Compatibility 20 points
-
WordPress, PHP, and WooCommerce (when relevant) are scored separately. The latest two PHP lines count as current. Nearby previous versions keep most of the points.
- Current version 100%
- One version behind 75%
- Two versions behind 50%
- Three versions behind 25%
- Older or not listed 0%
- Releases 15 points
-
One release earns 10, two or three earn 13, and four or more earn 15. Each accepted product ZIP counts once; reprocessing the same upload and listing-only edits do not count.
- Developer activity 15 points
-
Based on WPBay login and dashboard activity. Exact last-login dates are never shown.
- Support 15 points
-
There are no recent WPBay tickets to measure.
- Docs and demo 5 points
-
Documentation: 2. Changelog: 1. Working demo or preview: 2.
Score ranges
- 90–100 Excellent
- 75–89 Healthy
- 60–74 Fair
- 40–59 Needs attention
- 0–39 Limited
Long gaps
WPBay also checks for long gaps between updates, developer activity, support replies, and releases. Buyers do not see this score.
- Time since update 35 points
- Last developer activity 25 points
- WordPress compatibility 15 points
- Support replies 15 points
- Fewer releases 10 points
-
Quality verified by WPBay
WPBay review- Reviewed version
- 1.3.1.2
- Review completed
- Reviewer
- CodeRevolution
- Review type
- Initial
No unresolved approval blocker was identified during WPBay’s proportionate review of this release. This is not a security certification or a guarantee that the product contains no defects.
-
 Future updates
-
WPBay support from CodeRevolution
-
GPL code, proprietary assets
-
Covered by the WPBay refund policy
-
Plugin maintenance snapshot
Relevant picks
You may also like
Similar products selected by category, features, popularity and freshness.



Ultimate Web Novel and Manga Scraper

From this seller
View seller store
More by CodeRevolution
Explore more bestselling products from this creator.




Reviews
There are no reviews yet.