
Performance Profiler
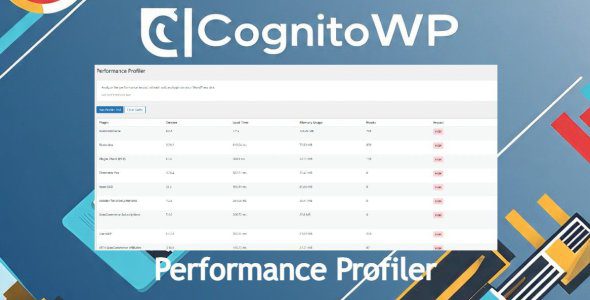
🚀 Performance Profiler by CognitoWP
Pinpoint the plugins slowing down your WordPress site.
See exactly how much memory and load time each active plugin adds—identify performance bottlenecks in seconds.
🧩 Key Features
-
⚡ Real-time Performance Analysis
Instantly measure load time and memory usage for each active plugin. -
🎯 Impact Visualization
Color-coded indicators (🟢 Low, 🟡 Medium, 🔴 High) make it easy to spot resource-heavy plugins. -
🧮 Admin Bar Widget
View live performance metrics right from the WordPress admin bar. -
🔗 Hook Analysis
Discover how many hooks each plugin registers—useful for developers and power users. -
💾 Cached Results
Run once, view anytime. Results are cached to avoid unnecessary overhead. -
🧼 Clean, Sortable Interface
Easy-to-read results table lets you sort by load time, memory usage, and more.
💡 How It Helps
-
🕵️ Identify plugins that degrade performance
-
🔄 Make smarter decisions about plugins to keep, replace, or remove
-
📉 Optimize load times and memory usage
-
📊 Track plugin performance over time
-
🛠️ Troubleshoot speed issues with confidence
👥 Perfect For
-
👨💻 WordPress Developers
-
🧑💼 Site Administrators
-
🧠 Performance Optimization Experts
-
🏢 Digital Agencies
-
⚙️ Anyone who wants a faster WordPress site
📦 Installation
-
Upload the
plugin-load-profilerfolder to/wp-content/plugins/ -
Activate the plugin via the Plugins menu
-
Go to Tools > Performance Profiler
-
Click “Run Profiler Test” to generate your first report
❓ Frequently Asked Questions
🔍 How does the profiler work?
It analyzes each active plugin’s load impact by measuring memory usage and execution time, offering both detailed and summary metrics.
🐌 Will this plugin slow down my site?
No. Tests run only when triggered manually and results are cached to avoid performance overhead.
🎨 What do the impact levels mean?
-
🟢 Low (Green): Under 10ms – Minimal impact
-
🟡 Medium (Yellow): 10–50ms – Moderate impact
-
🔴 High (Red): Over 50ms – Significant impact
⏱️ Can I schedule tests?
Currently, profiling is manual. Automated test scheduling may be introduced in future updates.
✅ Is the data accurate?
Yes, it provides reliable relative comparisons. Absolute values may vary depending on your server and current load conditions.
Changelog:
= 1.0.0 =
* Initial release
* Core profiling functionality
* Admin interface
* Admin bar widget
* Caching system
* Multilingual support ready
Only logged in customers who have purchased this product may leave a review.
 CognitoWP supports this product
Supported
CognitoWP supports this product
Supported

Product support includes:
- ✔ The seller will answer product related questions
- ✔ Assistance with reported bugs and issues
- ✔ Help with included third-party assets
However, product support does not include:
- ✖ Customization services
- ✖ Installation services
-
Quality verified by wpbay.com
-
Future updates
-
Support included from CognitoWP
More by CognitoWP


Reviews
There are no reviews yet.